Fibonacci is a mathematical sequence that has intrigued scientists, mathematicians, traders, and enthusiasts for centuries. A series of numbers known as the Fibonacci sequence has each number as the sum of the two numbers before it. The numbers in the sequence are 0 through 1, 1, 2, 3, 5, 8, 13, 21, 34, 55, 89, 144, and so forth. These numbers are not only found in mathematics, but also in various fields such as nature, art, and finance.
Leonardo Fibonacci, an Italian mathematician, is credited with popularizing the Fibonacci sequence in the West with the publication of his work Liber Abaci in 1202. In the book, Fibonacci used the sequence to solve a problem related to the breeding of rabbits, which led to the discovery of the sequence.
Fibonacci in Nature
The Fibonacci sequence can be observed in various aspects of nature. For example, the number of petals on flowers, the arrangement of leaves on a stem, the branching of trees, and the spiral pattern of seashells all follow the Fibonacci sequence.
One of the most famous examples of the Fibonacci sequence in nature is the spiral pattern of the nautilus shell. The nautilus shell follows a logarithmic spiral that expands at a rate determined by the golden ratio, which is a mathematical constant that can be derived from the Fibonacci sequence. The golden ratio is approximately 1.61803398875 and is often represented by the Greek letter phi (φ). The spiral pattern of the nautilus shell is not only aesthetically pleasing but also efficient, allowing the nautilus to grow and expand without sacrificing its structural integrity.
Fibonacci in Art
The Fibonacci sequence has also inspired many artists, architects, and designers. For example, the Renaissance artist Leonardo da Vinci used the Fibonacci sequence in his painting The Last Supper, where he used the sequence to determine the proportions of the table, the distance between the apostles, and the height of the room.
The Fibonacci sequence has also been used in architecture to create aesthetically pleasing buildings. The Parthenon in Athens, Greece, is an example of a building that uses the golden ratio in its design. The dimensions of the building, such as the ratio of the width to the length, follow the golden ratio.
Fibonacci in Trading
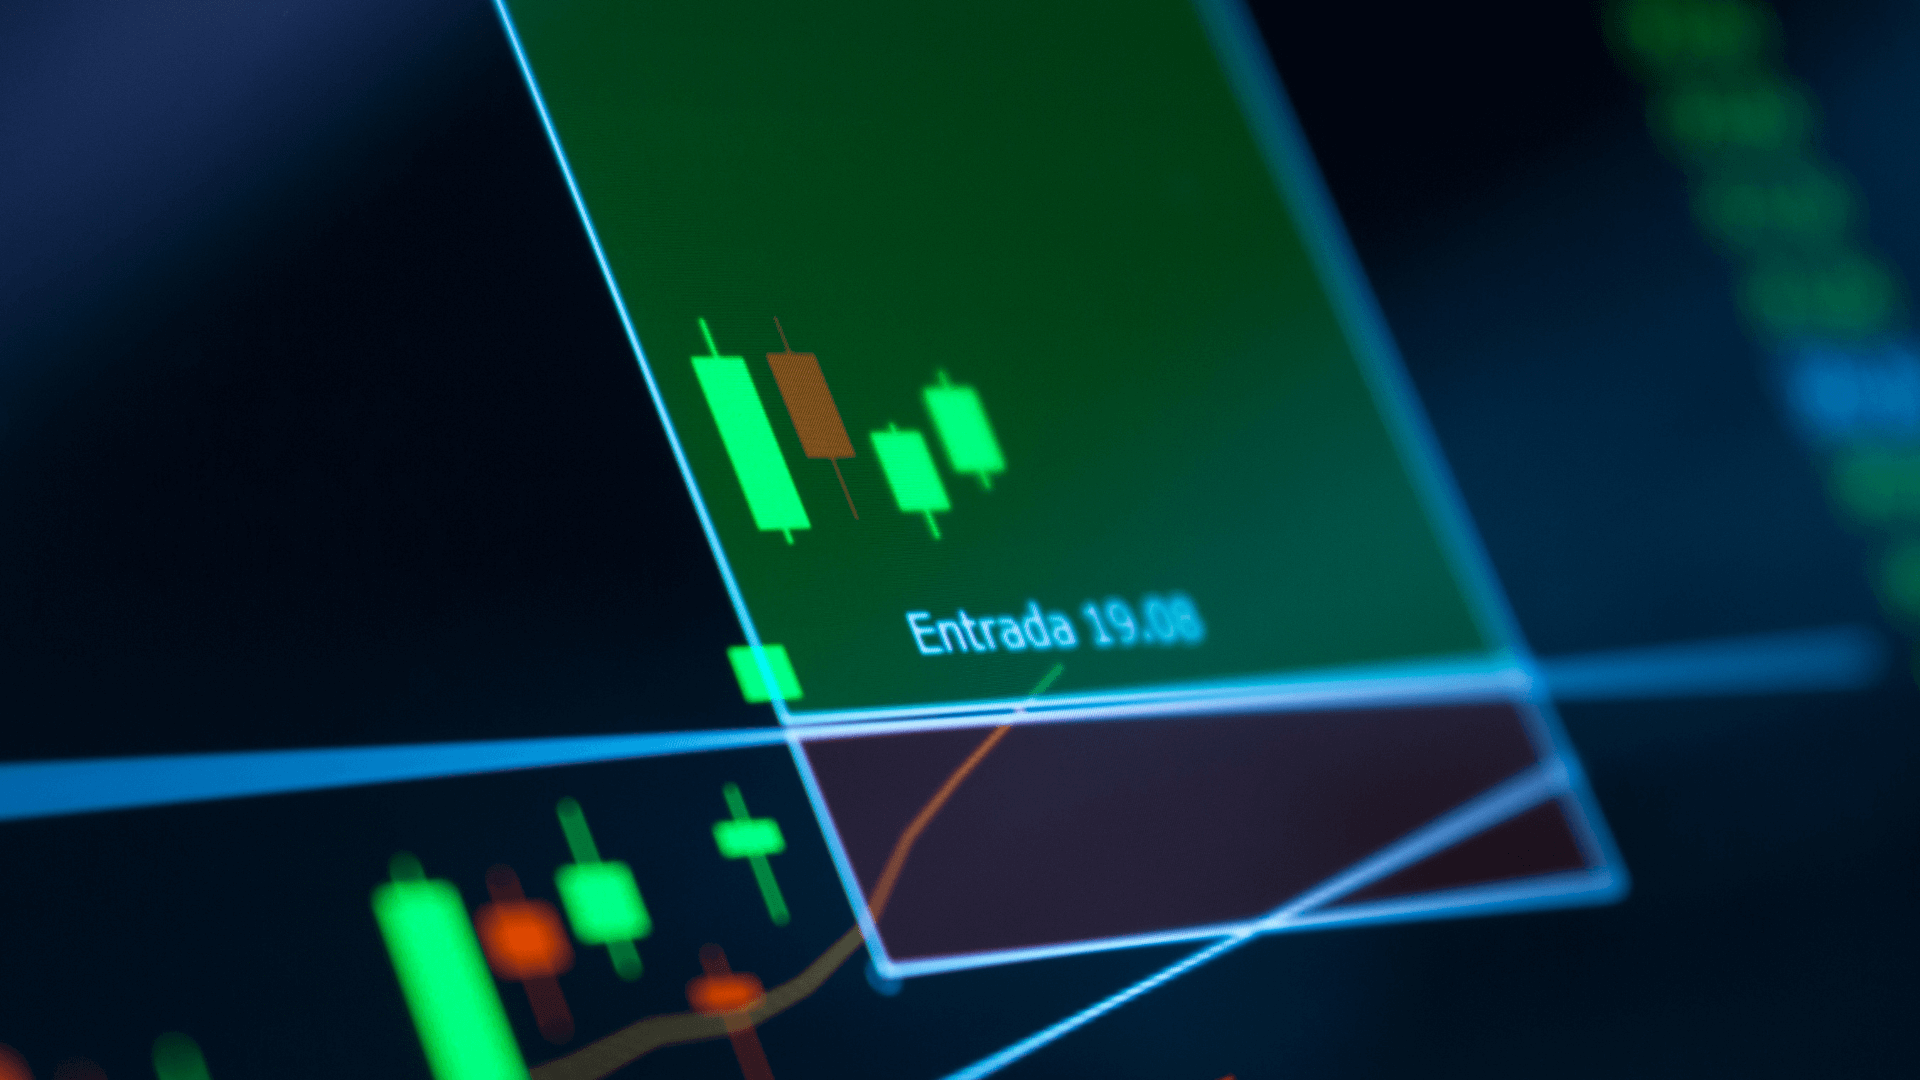
Fibonacci has also been used in trading to identify support and resistance levels, as well as to predict price movements. Traders use the Fibonacci retracement tool to draw lines on a chart that connect two points, such as a high and a low. The tool then draws horizontal lines at specific levels, such as 23.6%, 38.2%, 50%, 61.8%, and 100%, which correspond to the Fibonacci sequence. These levels are used to identify potential support and resistance levels and to predict price movements.
The 50% level, in particular, is considered to be a key level as it represents the halfway point between the high and the low. If the price retraces to the 50% level, it is considered to be a healthy retracement. If the price retraces beyond the 61.8% level, it is considered to be a potential reversal.
Fibonacci has also been used in trading to identify wave patterns. The Elliott Wave Theory, which is a form of technical analysis, uses the Fibonacci sequence to identify wave patterns in the price of an asset.
According to the theory, the price of an asset moves in a series of waves, with each wave consisting of a series of smaller waves. The Fibonacci sequence can be used to identify and name the waves, which can aid traders in forecasting future price alterations.
Conclusion
The Fibonacci sequence is a fascinating and ubiquitous sequence that can be found in various aspects of nature, art, and finance. The sequence has captured the imagination of people for centuries and continues to be studied and used in various fields.
In mathematics, the Fibonacci sequence has several interesting properties and applications. For example, the ratio of each number in the sequence to the previous number approaches the golden ratio as the sequence progresses. The golden ratio has several interesting properties, such as being the most irrational number and appearing in various mathematical formulas and constructions.
In finance, the Fibonacci sequence has been used in trading to identify potential support and resistance levels, predict price movements, and identify wave patterns. While the use of Fibonacci in trading is not without controversy, it remains a popular and widely used tool among traders and technical analysts.
The Fibonacci sequence has also inspired many artists and architects, who have used the sequence to create aesthetically pleasing designs and structures. The golden ratio is frequently used in art and architecture to create a sense of harmony, balance, and beauty.
The Fibonacci sequence is a reminder of the interconnectedness and beauty of the natural world, as well as the power of mathematics to describe and explain this beauty. Whether one is a mathematician, scientist, trader, artist, or simply a curious enthusiast, the Fibonacci sequence offers endless possibilities for exploration and discovery.
Fibonacci Tools Available in Trading
Fibonacci tools are widely used by traders in technical analysis to identify potential levels of support and resistance, predict price movements, and identify wave patterns. The Fibonacci sequence and ratios, which have been discovered to have some application in financial markets, provide the foundation for these tools.
Here are some common Fibonacci tools used in trading:
Fibonacci retracements: Before the market moves forward in the initial direction, this technique uses horizontal lines to show areas of support or resistance at crucial Fibonacci levels. These levels are calculated by taking the high and low of a particular price movement and dividing the vertical distance by the key
Fibonacci ratios of 23.6%, 38.2%, 50%, 61.8%, and 100%. To assist traders in locating probable levels of support and resistance, these levels are then shown on the chart.
Fibonacci extensions: This tool is used to identify potential levels of resistance in an uptrend or support in a downtrend beyond the current price levels. This is done by taking the high and low of a price movement and projecting potential levels of resistance or support by using the key Fibonacci ratios of 61.8%, 100%, 161.8%, 261.8%, and 423.6%. In order to aid traders in locating probable points where the trend may reverse itself, these levels are then placed on the chart.
Fibonacci arcs: This tool is used to identify potential levels of support or resistance based on key Fibonacci levels by drawing a series of curved lines that extend out from the high or low of a price movement. These curves represent potential areas of support or resistance and can be used to help traders identify potential areas where a trend may change direction.
Fibonacci fans: This tool is similar to the Fibonacci arcs but uses diagonal lines instead of curved lines to indicate potential levels of support or resistance. These diagonal lines are drawn from the high or low of a price movement and extend out at key Fibonacci ratios of 38.2%, 50%, and 61.8%. These lines are used to help traders identify potential areas where the trend may change direction.
Fibonacci time zones: This tool is used to identify potential areas of trend reversal based on time intervals rather than price levels. This is done by taking the length of a price movement and dividing it by the key Fibonacci ratios of 1.618, 2.618, 4.236, and 6.854. These time zones are then plotted on the chart to help traders identify potential areas where the trend may change direction based on time intervals.
While the use of Fibonacci tools in trading is not without controversy, they remain a popular and widely used tool among traders and technical analysts. The use of Fibonacci tools can provide a useful framework for understanding market movements and identifying potential levels of support and resistance. To make informed trading decisions, it's crucial to remember that these tools should be utilized in conjunction with other technical indicators and research.
Comments (0)

Categories
Recent posts
All about "Mutual Funds"
20 Feb 2023
Fibonacci in Trading & Tools
20 Feb 2023
Importance and Ways to perfect Elliot ...
20 Feb 2023
Importance of Trading Psychology
20 Feb 2023.jpeg)